Stop Counting Wins. Start Counting R.
By CryptoTraders · Strategy · 2026-06-08
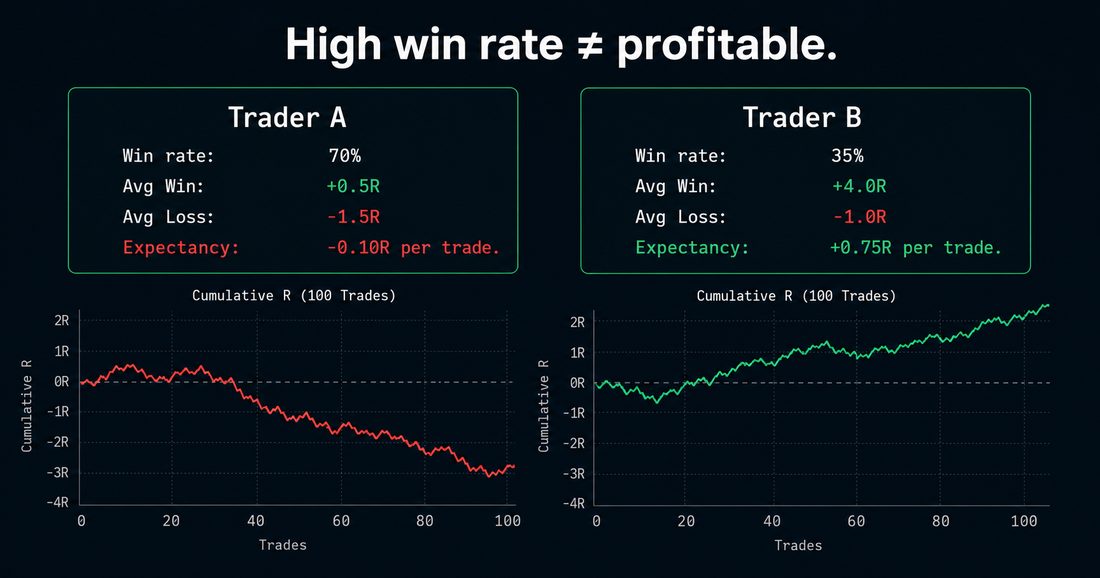
A 70% win rate sounds great until you realize the average winner is half the average loser. That trader is bleeding money. A 35% win rate sounds bad until you realize the winners run four times the losers. That trader compounds. Win rate alone does not tell you which one you are running.
R-multiples do.
R is the unit of risk on a single trade. You define it as the distance between your entry and your stop. If you enter BTC at $100,000 with a stop at $98,000, your R is $2,000. The size of R does not matter in isolation. What matters is how the trade resolves relative to it.
If you exit at $104,000, you made $4,000, which is +2R. If you stop out at $98,000, you lost 1R. If you move your stop to break-even and get tagged, you closed 0R. Every outcome is scored in the same unit, which is the whole point.
This is the framework Van Tharp formalized in Trade Your Way to Financial Freedom, and it is the standard professional traders and prop firms use. It works because it makes trades comparable across different setups, position sizes, and timeframes. A 2R scalp and a 2R swing both contributed the same amount to your expectancy. A 50% win rate at +0.5R average is a worse system than a 30% win rate at +2.0R average, and R-multiples make that visible at a glance.
Expectancy is the system's true score
Expectancy is the average R you earn per trade. The formula is: E = (Win% x Avg Win in R) - (Loss% x Avg Loss in R).
Plug in a 40% win rate with +2R average winners and a 60% loss rate with -1R average losers: E = (0.40 x 2) - (0.60 x 1) = 0.8 - 0.6 = +0.2R per trade.
That trader earns 0.2R per trade on average. If they take 200 trades a year, that is 40R of risk-adjusted return per year. Risk 1% of the account per trade and that is roughly a 40% annual return at modest drawdown.
Any positive expectancy defines a profitable system. Practitioners typically treat 0.2R as a real edge, 0.5R as strong, and anything sustained above 1.0R as exceptional and rarely durable at scale.
Frequency multiplies expectancy
Tharp's deeper point is that expectancy multiplied by opportunity count is what actually matters. A 1.0R system with 50 setups a year produces the same expected return as a 0.2R system with 250 setups. The trader chasing only the perfect setup is competing with a trader running a less-precise system on five times the volume. Both reach the same place at year-end.
This is why scanners and signal services exist. Manual edge is fine. Manual frequency is the bottleneck.
Common pitfalls
Four traps to avoid:
- Averaging R-multiples when sizing was inconsistent. If you risked 2% on one trade and 0.5% on the next, the R-multiples are not directly comparable in dollar terms. Standardize your risk first, or work in risk-adjusted dollar contributions.
- Recomputing R after moving the stop. The R denominator is the initial risk on the trade. If you moved your stop to break-even and got tagged, that trade is 0R, not a freeroll. The original 1R was the position you sized for.
- Ignoring fees and funding. On crypto perps, an eight-hour funding accrual can flip a marginal +0.3R trade into a 0R trade. Build them into your R math, especially on multi-day swing positions.
- Mistaking the R of one trade for the expectancy of the system. A single +5R trade is a data point. Expectancy only means something across a reasonable sample, ideally tens of trades at minimum and better across a few hundred, spanning different market conditions.
Where to start
A spreadsheet with the columns Date, Pair, Entry, Stop, Exit, R is enough. Track everything for thirty trades. You will find out very quickly whether you have an edge, or whether you have been confusing variance with skill.
How CryptoTraders reports this
Every algo in the CryptoTraders stack reports trade outcomes in R, not in percentages. Weekly performance posts show the trade list with the +/-R per trade and the aggregate. There is no win-rate hand-waving. If a setup ran 8 trades for +4.2R, that is the number, with the trade-by-trade breakdown attached.
It is harder to make this number look good than to make a win rate look good. That is why we use it.
Educational content, not financial advice. Trading leveraged products carries a high risk of loss.