Most Traders Read Price Only. Smart Money Reads Volume Also.
By CryptoTraders · Algos · 2026-05-18
Price action tells you what happened. Volume profile tells you why, and more importantly, where price is going next.
Every price level on the chart has a story written in volume. Some levels are heavily transacted. Institutions built positions there, and price tends to gravitate back to them. These are called high-volume nodes (HVNs).
Other levels are barely touched. Price passed through them quickly because neither buyers nor sellers wanted to transact there. These are low-volume nodes (LVNs), and they're where the real edge lives.
Here's the key insight from auction market theory: price moves fast through low-volume zones. When price accepts through an LVN, there's nothing to slow it down until it reaches the next HVN or value area. That's where the explosive, one-directional moves come from. The ones that seem to appear out of nowhere on a regular candlestick chart.
Most retail traders are staring at EMAs and RSI while institutions are reading the volume profile, identifying where liquidity is thin and positioning before price tears through it.
How to spot it yourself
Start by building a volume profile on the daily or 4H timeframe. Look for the LVNs, the visible gaps in the profile where volume drops off sharply. Then watch for price to approach and accept through one of those nodes. The move toward the next HVN tends to be fast and one-directional.
This is auction market theory applied to crypto, and it works because it reads the structure of the market rather than just the surface.
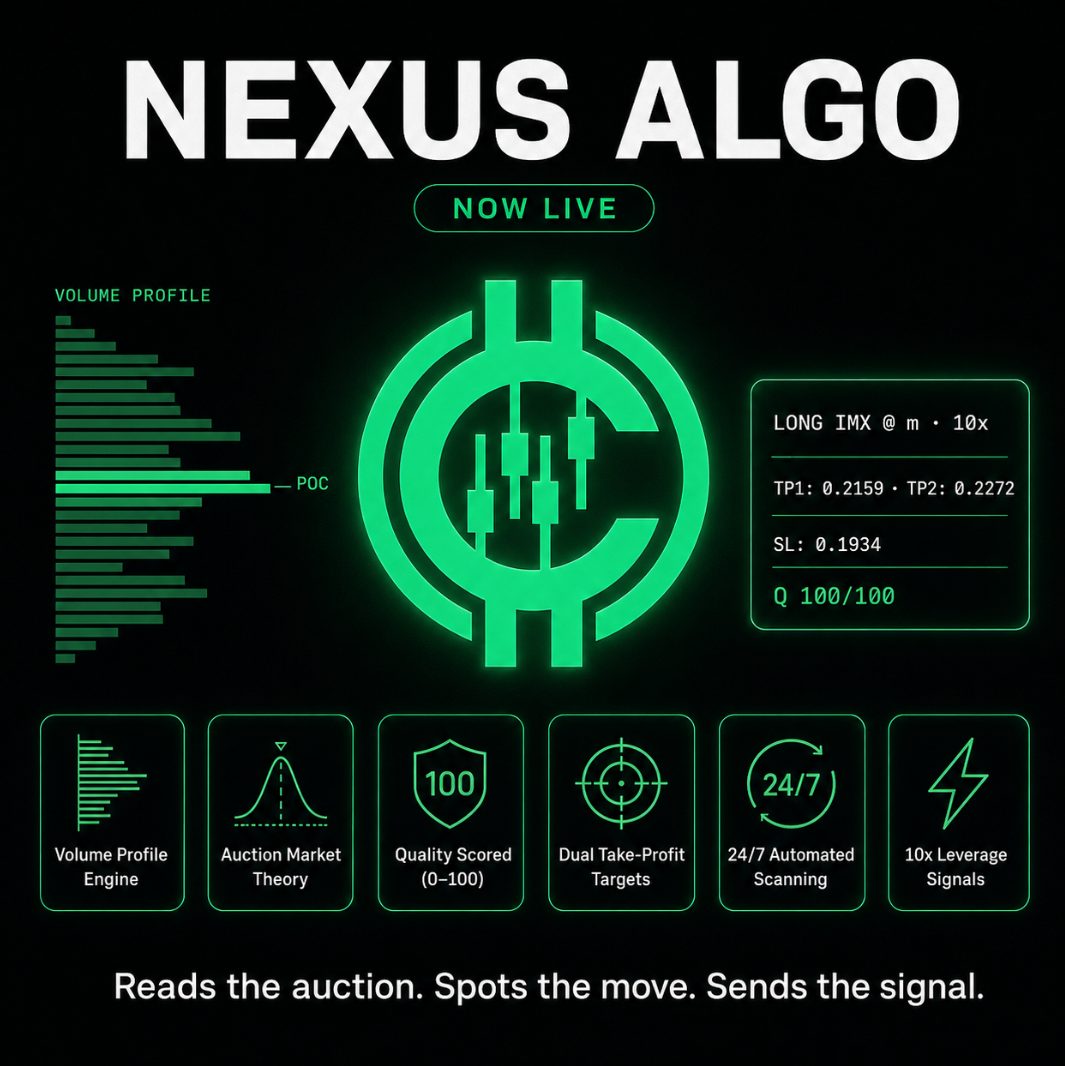
We built an algorithm around this exact concept. It scans altcoin perpetuals around the clock, identifies LVN acceptance events, validates each setup through a quality score (0–100), and sends the signal with full reasoning: the auction phase, the profile shape, and why the trade was accepted.
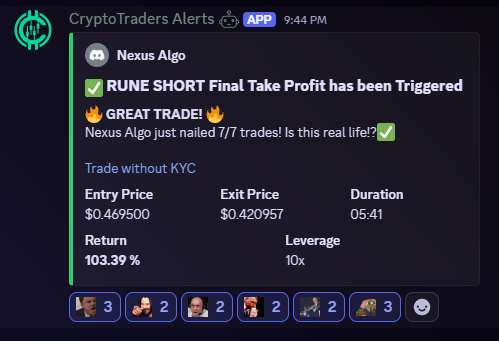
The result? 7/7 trades hit. The latest: RUNE SHORT, 103.39% return in under 6 hours.