Price Lags. Open Interest Leads.
By CryptoTraders · Algos · 2026-05-22
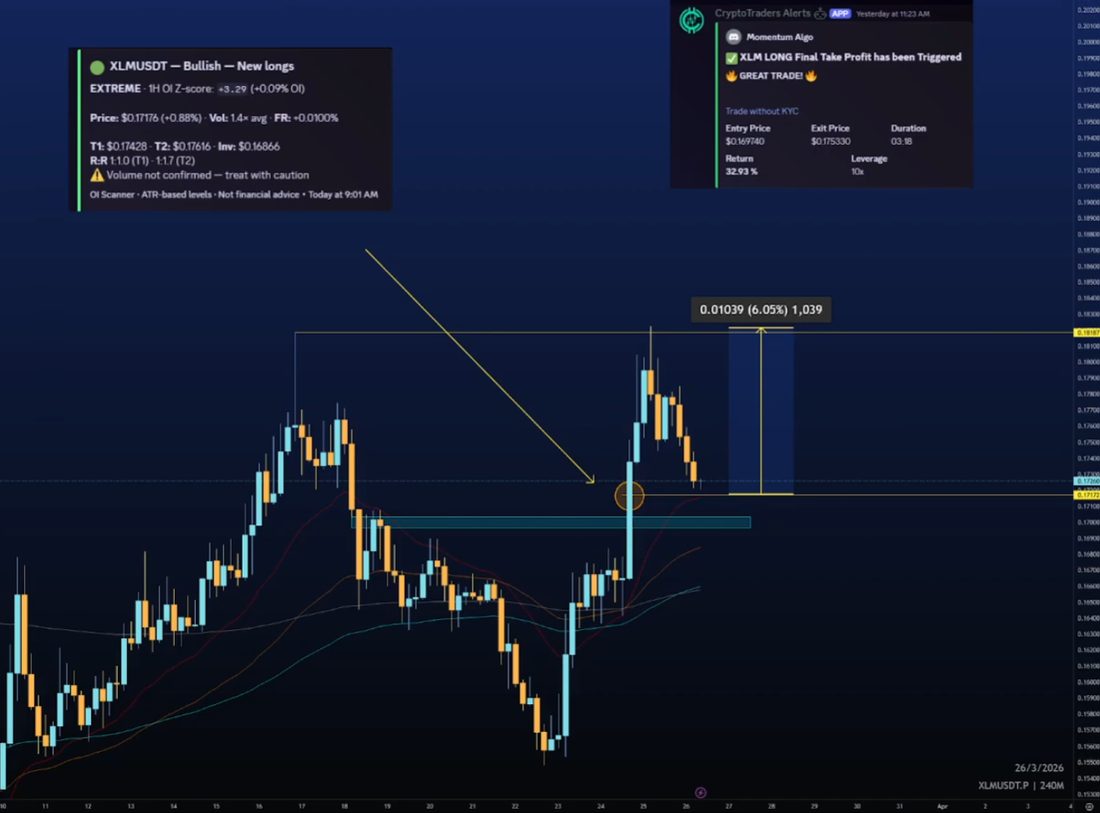
Price tells you a trade happened. Open interest tells you a position was opened. Those are two very different signals, and only one of them is leading.
When a candle closes green, you know someone bought. You don't know if it was a long entering, a short closing, or both at once. The candle is ambiguous. Open interest is not. When OI rises alongside the move, new capital is committing in the direction of price. When OI falls, the move is short covering or longs taking profit, and the trend is hollow.
This is why open interest is the cleanest leading read in derivatives markets. It separates fresh conviction from positional unwind. The trouble is that raw OI numbers are useless without context. A 2% bump on a coin that usually moves 5% in a day is noise. The same bump on a coin that usually drifts 0.2% is a flare going off.
Why the threshold has to adapt to the asset
Every coin has its own volatility profile. Bitcoin's open interest swings on a different scale than a low-cap altcoin. Using a flat percentage threshold to filter for unusual activity will either catch noise on quiet assets or miss real moves on volatile ones. The only honest approach is statistical: how unusual is this surge relative to this asset's own history?
That's what a Z-score does. It measures how many standard deviations the current OI change sits from the asset's normal range. A Z-score of +3 means this is a rare event for this specific coin, regardless of how big the absolute number looks. It puts BTC and a low-cap on the same scale.
An OI surge alone is not a signal
A spike in isolation is a clue, not a trade. Sometimes it's coordinated longs piling in before a real move. Sometimes it's a thin-liquidity squeeze that fades within the hour. The difference shows up in the surrounding context.
Real conviction lines up across multiple readings at once: the higher-timeframe trend, momentum, volume confirming the print, funding rate, RSI position, the direction of price during the surge, and whether liquidity is deep enough to hold the move. Any one of these can be flipped without breaking a thesis. All seven aligning is much harder to fake.
How to use this yourself
Pull up the 1H open interest chart for the pair, compare the current change against its own recent baseline, then only act if price, volume, and funding agree with the direction of the OI move. Skip anything where the surge is happening into thin volume or against the higher-timeframe trend. Most of the noise gets filtered out at that step.
What's hard to do manually is keep this watch running across every Bybit perp with meaningful open interest, every hour, without missing anything. That's the gap an algorithm closes.
What Momentum Algo does
Momentum Algo scans every Bybit USDT perpetual with meaningful open interest, on the 1H timeframe with a 4H trend bias. Its primary trigger is a Z-score normalised OI surge that's statistically unusual for that specific coin, not a flat percentage that misbehaves at the edges.
Every trigger then runs through a seven-factor confluence stack: trend, momentum, volume, funding, RSI, price direction during the surge, and liquidity. The signal that ships shows the actual values from each of those checks, not a single confidence number. You see exactly which factors lined up and which were borderline.
Stop and take-profit levels are ATR-based, so the algo respects each coin's own volatility rather than forcing every trade onto the same risk template. Weekly performance reports post on Mondays.
The XLM long shown above is a clean example. Entry filled at $0.169740, final take profit triggered at $0.175330. A 3.29% price move translated to a 32.93% return on the position at 10x leverage, closed in three hours and eighteen minutes.