The Bid Now Comes from the ETFs.
By CryptoTraders · Market Education · 2026-06-02
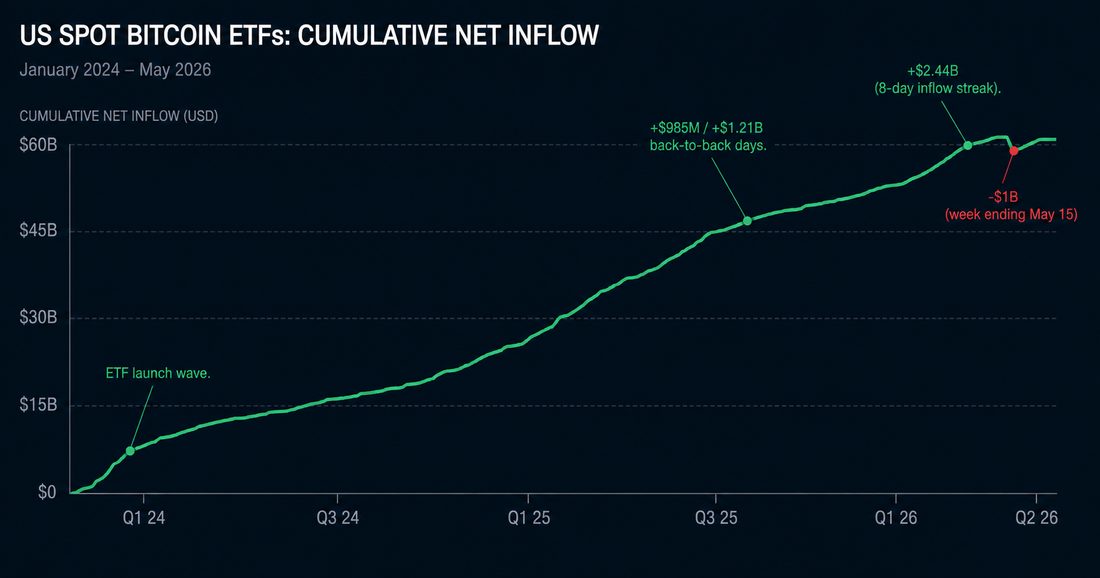
For its first fifteen years, Bitcoin's marginal buyer was a retail trader on an exchange. Since January 2024 that is no longer true. The marginal buyer is a US institutional flow into a spot Bitcoin ETF, sized in tens of millions a day, sometimes hundreds. If you trade Bitcoin perpetuals and you are not watching ETF flow data, you are missing the largest single input into where the bid is coming from.
Where the flows are
US spot Bitcoin ETFs crossed $60 billion in cumulative net inflows in the back half of May 2026. Total AUM across all of them sits around $102 billion. BlackRock's IBIT is the single dominant fund, holding 49 to 60% of total ETF AUM depending on the week, and the share has only grown since launch. Fidelity's FBTC is a distant second around 15%, with Grayscale's GBTC, ARK 21Shares' ARKB, and Bitwise's BITB making up most of the remainder.
The concentration matters. When an inflow day comes in heavy, somewhere between 50% and 70% of that flow lands in IBIT alone. One desk's allocation decisions move the needle.
What flows correlate with
There is no widely-cited peer-reviewed study correlating ETF inflow days with perp open interest changes, but the empirical pattern is consistent enough that desks reference it openly. On heavy-inflow days, BTC perp OI tends to rise and funding typically skews positive within hours to days. The mechanism is mechanical: ETF authorised participants buy spot to fulfil creation orders, the spot bid lifts the price, the perp basis widens, and arbitrage shops short perps to capture cash-and-carry. Layered on top of that, retail FOMO chases via leveraged longs, which is what drives the funding skew.
The October 2025 case is the textbook example. Inflows of $985M on Oct 3 and $1.21B on Oct 6 coincided with sharp BTC perp OI expansion and a run to the $126K ATH within weeks.
The inverse pattern on outflow days is less consistent. Sellers can be patient where buyers cannot, so heavy outflows do not always show up as immediate perp OI compression. They tend to drag, not snap.
April to May 2026 as a live example
April 2026 was the strongest month of the year. Net inflows totalled $2.44B, including an 8-day inflow streak from April 14 to April 23 that pulled in $2.1B. The macro trigger was US-China trade-deal optics and a pause on tariffs. Perp OI on BTC built steadily through the streak and funding turned and stayed positive.
Then May reversed. The week ending May 15 saw roughly $1B in net outflows, snapping a six-week inflow streak. May 7 alone took $268M out. The drivers were a hot 3.8% CPI print, rising Treasury yields, and fading Fed rate-cut expectations. Perp positioning compressed accordingly, with funding rolling back toward neutral and OI on the major venues flattening.
That sequence is the clearest recent illustration of why perp traders cannot ignore the flow data. The biggest macro inputs into the Bitcoin bid in 2026 are coming from a US equity-market product that perp traders do not normally follow.
The weekend gap
US spot Bitcoin ETFs trade only during NYSE hours, which means Monday through Friday, 9:30 AM to 4:00 PM ET. Closed on weekends, closed on US market holidays. Bitcoin perpetuals trade 24/7. Three implications follow.
First, the ETF flow signal goes dark from Friday 4 PM ET to Monday 9:30 AM ET, a 65-hour window during which weekend perp positioning can shift materially without any institutional flow input. Second, Friday late-day flow direction is often the dominant signal carried into Monday open. A heavy outflow Friday afternoon followed by a quiet weekend often pre-positions perp shorts before the Monday open. Third, Monday gap-fill or gap-extend behaviour is heavily influenced by the weekend OI and funding build relative to where Friday's last ETF flow print left things.
Where to get the data
Four sources are standard. Farside Investors (farside.co.uk/btc) publishes daily totals per ETF, usually by evening of the same trading day US time. SoSoValue has daily and cumulative dashboards. CoinGlass (coinglass.com/etf/bitcoin) shows flows plus AUM plus holdings. The Block (theblock.co/data/etfs/bitcoin-etf) covers chart-based daily flows. All four pull from official issuer NAV and creation/redemption disclosures, so the numbers reconcile. Lag is T+0 evening to T+1 morning depending on the source.
How CryptoTraders feeds this in
The Crypto Intel Brief surfaces material institutional flow events as part of its daily synthesis under the Institutional & Market Structure category, with significance tiers attached so you can scan for the inflow or outflow days that actually matter. Combined with the OI Scanner watching perp positioning in real time, you have both halves of the picture: the spot bid coming in, and how the leveraged side is responding.